In my last update I had predicted that the oil market would be on a solid footing going forward given Asian / Chinese buying would return (after maxing out purchases of Iranian barrels), Europe and the rest of the developed world would continue progressing on vaccinations, and supply discipline from both OPEC+ and US Shale producers would continue.
Most of those predictions have turned out to be correct, but as is always the case with oil and macro analysis, there are some new risks / factors to consider:
1/ Vaccination rates have continued to climb, but now we have to deal with a new mutation of the virus (commonly referred to as the Delta Variant) which is extremely contagious (R0 of 6-8) and impacting not only the under-vaccinated developing countries, but also developed economies like the UK and the US
2/ OPEC+ reached an agreement to maintain supply discipline and gradually raise production for the rest of the year and into 2022, but only after several tense negotiating sessions which uncovered disagreements between UAE and Saudi Arabia. This understandably unnerved the markets given memories of the Saudi/Russia price war debacle are still fresh in investors’ minds
These two risks had started weighing on sentiment in early June, when XOP was rejected off of the 100 level. After failing to break this level several times, oil equities began to fall in earnest starting early July. The price action in oil equities was a leading indicator of what was to come for oil, which continued to trade at 70+.
Starting July 14, oil finally started to dive and took a 15% draw down from the mid-70s to the mid-60s. The fall in oil equities was even more dramatic with XOP and Gear Energy falling ~25% and 40% from their June highs respectively.
The violent unwind in the energy sector was likely a function of positioning which had become too bullish. According to RBC there were 8.6 long contracts for every short contract in WTI futures market, so a swift retracement was going to be inevitable as the market re-calibrated the future trajectory of oil demand recovery and the probability of fresh mobility restrictions / lockdowns. Since then, oil prices have recovered back above 70, while oil equities have continued to languish.
In my opinion, the recovery in oil is a symptom of the current physical market conditions which remain extremely tight as oil demand continues to recover and inventories continue to draw.
Source: HFI Research
In the US, crude oil inventories are now below the 2019 levels due to strong pick up in mobility and demand for gasoline combined with a lack of recovery in US Shale production.
Source: Twitter @GasBuddyGuy
In fact crack spreads globally suggest that the strong demand story is not just a US phenomenon but rather the rest of the world is also out and about.
Source: Energy Aspects
Brent 1-12 time spread is another indication of strong physical demand globally.
Source: Barchart.com
Oil equities seem disconnected from current oil prices / physical market conditions because they are likely discounting the potential future risks posed by the Delta variant and a potential OPEC+ price war. Are these worries justified? Parts II and III of this update will assess these risks going forward.
The age of fossil fuels is coming to an end (albeit more slowly than the media would have us believe). As I wrote in my book review back in 2019, climate change is a disaster that we have to avoid, there is simply no other option. Renewables are part of the solution – but I believe the current dialogue on climate change is too focused on the potential for renewables and missing some important economic and scientific realities.
Source: JPM Research
There are two major problems with renewables: 1/ reliability and 2/ energy density.
The first point is fairly simple to understand: the sun doesn’t always shine and the wind doesn’t always blow. See the recent Texas power outage as an example.
Or look at Germany. Germany is the world leader in solar and wind energy but has experienced CO2 emissions rising while bearing some of the highest power prices in the world. The reason is simply that Germany has had to rely on back-up fossil fuel generation to account for the volatility in wind / solar output. They’ve also had to spend a lot more on infrastructure (e.g. transmission) to integrate both renewables and back-up generation into the grid. Electricity costs in Germany have risen more than 50% since they introduced the renewables initiative.
The second point, energy density, requires some understanding of physics. In very simple terms, energy density refers to how much energy is stored in a certain volume of a given energy source. Solar and wind are low energy density sources which means that solar and wind farms require large areas of land to produce sufficient electricity to meet current consumption.
A country like Japan for example would have to cover the majority of its available land with solar panels and wind turbines to generate enough power to satisfy the country’s power needs. This would mean significant disruption to wildlife and ecological systems. Wind turbines are a serious threat to important / threatened bird species like hawks, eagles, condors. Similarly, solar farms require clearing large areas of land of wildlife and vegetation. One of the biggest solar farms in California required biologists to pull threatened desert tortoises from their burrows and transport them to cages where many ended up dying.
One also needs to factor in what happens to solar panels and turbines after the end of their useful life. Disposing off of tons of glass, cement, steel, concrete is no easy task and adds to the financial and environmental costs associated with renewables. Here is an excerpt from a Bloomberg article describing the challenges of disposing off of wind turbines:
“Tens of thousands of aging blades are coming down from steel towers around the world and most have nowhere to go but landfills. In the U.S. alone, about 8,000 will be removed in each of the next four years. Europe, which has been dealing with the problem longer, has about 3,800 coming down annually through at least 2022, according to BloombergNEF. It’s going to get worse: Most were built more than a decade ago, when installations were less than a fifth of what they are now.
Built to withstand hurricane-force winds, the blades can’t easily be crushed, recycled or repurposed. That’s created an urgent search for alternatives in places that lack wide-open prairies. In the U.S., they go to the handful of landfills that accept them, in Lake Mills, Iowa; Sioux Falls, South Dakota; and Casper, where they will be interred in stacks that reach 30 feet under.”
In summary, when people claim that wind and solar are ‘cheap’ they are often ignoring the costs of backup generation, transmission, ecological / environmental costs and disposal costs. Germany’s experience teaches us that relying too heavily on wind / solar can lead to exorbitantly high electricity prices with little / no impact on CO2 emissions.
The Solution
The same physical properties that make Uranium so dangerous as an atomic weapon, are what make Uranium so useful as an energy source: the process of nuclear fission releases very large amounts of energy from a very small mass and doesn’t produce any greenhouse gases. A single soda can volume of Uranium provides enough energy to fuel an individual’s annual electricity consumption in the US. All the nuclear waste produced by the US in more than 50 years of operation would, if stacked end to end, cover a football field to a depth of less than 10 yards.
If the world is really committed to reducing carbon dioxide emissions while also meeting rising energy needs (especially in the developing world) – nuclear will have to be a bigger part of the solution. Unfortunately, there is a major misconception regarding the safety aspects of nuclear energy that have prevented widespread adoption.
In 2011, the Fukushima incident sent a shock wave of anti-nuclear sentiment globally. Some countries like Germany took the extreme step of phasing out their entire fleet of nuclear reactors. In Japan, only 9 of 54 existing reactors have been authorized to operate. All of this, despite increasingly strong evidence that the Fukushima incident caused limited (if any) radiation health risk and the fact that phasing out nuclear necessarily means using more fossil fuel-based electricity generation (which harms far more people through CO2 emissions). In contrast a country like France that has continued to generate 75%+ of its electricity from nuclear has enjoyed cheap electricity with low CO2 emissions.
The lesson from Fukushima isn’t that nuclear power is dangerous, but rather that with the right checks and balances even a full reactor meltdown can prove harmless. Fukushima has also led to improvements in reactor design and new regulations which further reduce the risk associate with nuclear power plants.
Despite all the scary headlines, nuclear remains the safest and cleanest form of power in the world, causing only 0.07 deaths per 1 terawatt-hour of energy production, compared to 2.8 for natural gas and 24.6 for coal including deaths from accidents and air pollution.
The Tide Is Turning
10 years after Fukushima, public perception on nuclear is finally starting to change. On March 25, 2021 U.S. Senator Joe Manchin made the following comments at the U.S. Senate Energy and Natural Resources Committee hearing:
“Every year in the U.S., nuclear-generated electricity prevents more than 506 million metric tons of carbon dioxide from entering our atmosphere. If we are serious about meeting our climate goals without sacrificing reliability, we must protect our existing fleet. Why then is the U.S. fleet decreasing and why are we taking them offline?… We’ve got to now find out every nuclear plant that’s on the chopping block and make the CEOs of those companies come here and tell us why they’re taking offline something that should never have been taken offline or even considered taken offline, and why we can’t make sure they can operate. We can do that, that’s our job here in Congress, for the sake of our country”.
In Japan, the epicenter of the nuclear safety debate, 9 nuclear reactors have restarted (mostly recently in April this year) since the Fukushima incident, with 3 more expected to get approval to restart in the near future.
In fact, there are currently 54 reactors currently in development in the world with China and India taking the lead.
China’s newly announced 14th Five-Year Plan for Nuclear Power targets power output of 70GWe by 2025. The China Nuclear Energy Association estimates that the country’s nuclear capacity will reach 130GWe by 2030. This is a pretty mind-boggling level of power production. China will need to build an additional thirty-five reactors this decade to meet this goal.
India is not far behind. Last month, France’ EDF filed a binding offer to supply engineering studies and equipment to build 6 nuclear reactors in Jaiapur, India. Nuclear power generation is expected to triple in India by 2031.
Investment Implications
While the tide is turning on Uranium demand in both the developed and developing world, supplies continue to languish. Over the last several years, many of the largest Uranium mines have curtailed production because spot prices have been simply too low. The two largest Uranium producers (Cameco and Kazatomprom) remain committed to observing supply discipline after experiencing almost a decade of spot prices that were below the all-in sustaining cost (AISC) for a significant percentage of their production. COVID-19 related mine closures have further exacerbated the supply situation.
Most Uranium is bought under long-term contracts by utilities, and until those contracts expire and inventories are drawn down (and utilities are forced to re-contract or buy in the spot market), the current spot price will continue to remain too low to incentivize new capex and production increases.
This could change if financial demand for Uranium picks up and forces the utilities’ hands (something I will cover in more detail in follow-up articles), but for now most utilities seem to be asleep at the wheel and/or content to let their contracts expire, run down inventory and risk re-contracting at a much higher prices in the future.
The percentage of utility demand under long term contracts has already fallen significantly over the past few years and inventories that were built during the demand shock in the post-Fukushima era are the only cushion insulating further spot price increases.
So what is the right spot price? Let’s take a look at the current supply/demand picture.
Base on most analyst estimates, the world will need to produce 200mm lbs/year + of U308 (Uranium oxide) to meet demand post 2025. Currently, only about 105mm lbs/year of supply has an AISC below today’s spot price of ~$30 / lb. In fact, only 140mm lbs/year has an AISC of below $50 / lb. A significant portion of this capacity (~20mm lbs/year) capacity is on ‘care and maintenance’ and some of it (~3mm lbs/yr) depletes every couple of years.
Sachem Cove Partners estimate that a $55 / lb long-term price is a starting point to incentivize new production and that much higher prices will be needed to eliminate the projected deficits. This is because of the sheer scale / magnitude of the demand increase required to meet the aggressive nuclear development plans announced by China and India over the next 5-10 years. In order to meet the recently announced nuclear development plans, the world will need to replicate 2-3 of the world’s current largest Uranium mines!
Below is a supply/demand forecast from Canaccord Genuity projecting a 100mm lbs/d deficit by 2030 even if spot prices increased on $60 / lb:
Here’s another one from TD Securities projecting a cumulative ~120mm lbs deficit from 2020 – 2025:
As more sell-side analysts are coming around to the view that the Uranium market is entering into a multi-year deficit, the investment community is also starting to wake up. Uranium ETFs like URNM and URA have seen massive inflows and increased their assets under management manifold.
The last time the world was on the verge of a Uranium supply deficit (in 2005 – 2007), uranium spot prices increased 10 – 12x to $130 / lb+. I believe the conditions for today’s bull market are far more constructive for a sustained price increase: 1/ the market is already in deficit 2/ the potential runway for demand is far larger and structural and 3/ there is a strong focus in the investment community to support ‘ESG’ investments which could be a big catalyst for fund flows and increased financial demand for Uranium (which will exacerbate the physical market deficit already discussed).
While Uranium spot price is already ~70% above its lows and many miners stock prices have multiplied manifold since, I believe this move is just getting started. Investors today are faced with a once in a generation opportunity to take part in major transformation of the energy landscape over the next decade. When the industry leader (Cameco) stock price breaks out of a decade + downtrend on high volume, the market is telling you the game may have changed. Are you paying attention?
In my last post I stated that I had taken profits on a number of my energy positions and recommended a cautious approach around oil stocks. I warned that the 3rd wave of the virus is dampening sentiment, and that the physical market was weakening because Chinese buying had slowed down.
Most recently we had the restart of talks between the US and Iran around re-instituting the JCPOA and removal of sanctions which is another bearish catalyst to watch out for.
Over the next couple of weeks, a number of these headwinds are going to start clearing. The physical market has already started perking up and this will accelerate as China steps up its buying into the summer peak demand season.
Brent time spreads have started recovering:
Bloomberg recently reported a pick up in Asian market activity:
“The pick-up in activity across the key Asian market comes amid a flurry of signs that global oil consumption is improving as economies including the U.S. shake off the impact of the pandemic. This week, both the International Energy Agency and Organization of Petroleum Exporting Countries issued positive outlooks, even as the cartel and its allies plan to ease supply curbs. So far in 2021, Brent futures have soared 30%, and last traded near $67 a barrel.
In Asia, traders had been waiting for further signs of improved demand across the region after buying of spot cargoes by China was muted in March, weakening the overall Asian physical market. That retreat of Chinese buyers coincided with its bigger intake of U.S.-sanctioned Iranian crude, and as higher prices and the backwardated market structure incentivized local de-stocking.“
Meanwhile inventories globally have continued to draw.
The IEA’s most recent oil market report shows that OECD inventories are almost back to 2016 – 2020 average. Now admittedly this average is a bloated number, but it still marks an important milestone for a sector that many investors have left for dead.
As we think about the months ahead, it’s important to focus on the pace at which vaccinations are ramping up. While the 3rd wave headlines are scary, in my opinion the bigger story is the speed at which vaccines have been approved and the high vaccination rates in countries like the US, UK, Israel etc.
Europe has been a disaster on the vaccination front, but despite all the setbacks and mismanagement, I believe European vaccination rates are also going to ramp up rapidly over the next few weeks.
The European Commission expects an average of 100mm doses per month to be distributed throughout the EU from April to July and for roughly half of Europeans to be vaccinated by July.
All of this means that economic activity in the US will pick up rapidly over the next few weeks. Europe will be a bit behind but should be able to to lift economic restrictions over the next few months.
What does this mean for the oil market? Based on inventory data, February showed an implied deficit of 2mm b/d. As demand picks up, this deficit will widen to 3mm b/d+ Q2 onwards which, holding all else constant, will likely lead to a spike in oil prices. OPEC+ is doing the same analysis and is therefore comfortable increasing production at this point.
On April 1st, OPEC agreed to increase production by 350K b/d in May, June and 441K b/d by July. This increase of ~1.1mm b/d by July will still leave a hole of 1.5 – 2mm b/d+ that needs to be filled in Q3 / Q4 of this year. Now let’s assume that Iran sanctions get lifted. The earliest Iran could bring more barrels on the market would be in the second half of this year. According to my sources, Iran is already exporting 1.5mm b/d in the black market. It could increase exports by a further 1.2mm b/d based on its available production capacity. This means that even if sanctions come off and Iran produces all-out in the second half of this year, the coming demand rebound will likely result in a deficit for the rest of year given the lack of supply growth from the rest of the world.
Conclusion:
The oil market is at an important inflection point. Physical demand has weakened over the last month or so due to increased Chinese buying from Iran. 3rd wave fears and re-start of JCPOA talks have been a further drag on sentiment
However as we look forward, these headwinds should soon dissipate and oil should start moving back up again. Chinese refiners have already started buying more and will continue to ramp up over the summer
Despite all the set backs, vaccination rates are rising all over the developed world. While COVID cases are going up right now, if a majority of high-risk individuals can be vaccinated by the summer, countries are likely to lift economic restrictions which will unleash massive pent-up demand for travel/consumption
Recent inventory data show that the market is already in a significant deficit. As the deficit widens over the summer, increase in OPEC+ barrels will be easily absorbed. Even a return of Iranian barrels in H2 2021 should be ok given the magnitude of the deficit and lack of supply growth from the US / ex-OPEC producers.
While there is a risk of further complications with vaccines over side-effects / safety concerns and the risk of new virus mutations/variants- I think the odds now favor adding back energy positions.
An Iran deal announcement would likely lead to a knee-jerk reaction / sell off in the near-term, so it might make sense to wait until the talks are finished this weekend. As the market calms down and looks forward to the supply / demand balances, prices should eventually recover even in a deal scenario.
I haven’t been writing a lot recently as I feel I’ve said all I needed to say in a few key articles written in 2020.
In May I wrote a portfolio update titled “How I’m Investing Now” in which I laid out very clearly the different stages of oil market recovery and my contrarian view that the oil market would recover faster than most were expecting. I recommended buying refiners (CRAK) because product inventories were going to recover first, and then as oil inventories started normalizing, to load up on upstream / E&P stocks.
I expressed a high level of conviction regarding Canadian E&Ps and I recommended Gear Energy (my largest position) and the ETF XEG (which offers more diversified, large cap Canadian E&P exposure).
Since that recommendation in early May 2020, WTI is up ~151% and the returns on the specific investment recommendations are as follows:
Gear +136% XEG +59% CRAK +34%
Earlier in April I had written a post titled: “Why Natural Gas Is Poised to Benefit From Oil Market Collapse”. While some of my specific predictions didn’t turn out to be correct (for example I missed the large drop in LNG demand from Asia when making my supply / demand estimations), the broader bullish thesis around natural gas has played out.
In April 2020 the nat gas pricing curve for the coming few months was somewhere in between $1.9 – 2.1/MMBtu. Since then, gas prices are up almost 70% as the reduction in shale drilling activity has prevented natural gas production from regaining its prior highs of around 94 – 95 Bcf/d. Meanwhile LNG demand has recovered and domestic demand has remained resilient relative to pre-COVID levels.
I had recommended buying FCG as a buy-and-hold ETF with a basket of natural gas weighted names. You could also have bought the ETF XOP which offers more balanced oil and natural gas exposure. Since the April recommendation, the returns on those investments are as follows:
My current view on the oil market is more cautious.While I remain long-term bullish, I believe we need to overcome a couple of near-term speed bumps before getting to the promised land; specifically, we need to ensure governments can mitigate the rising risks of a 3rd COVID wave (potentially accelerated by virus mutations) by ramping up vaccination programs and we need Chinese refiners to return to the market (Chinese buying has paused recently and resulted in a weaker physical market).
I will write a more detailed piece on this in the coming weeks, but for now I’ve taken profits on a significant portion of my energy exposure (particularly leveraged / options positions).
Macro Update
On the macro side, I wrote a couple of high-level pieces on where I think we’re headed with respect to the current debt cycle. In “A Possible Path Forward” I surmised that economic normalization / re-opening would probably take 6- 12 months and that a V-shaped recovery is unlikely as unemployment and savings could be structurally high coming out of the crisis. What I failed to predict was a democratic sweep and unprecedented fiscal stimulus wave which now promises to unleash a flood of pent-up consumption demand which could drive inflation and GDP growth higher than what I had expected.
Post this near-term fiscal surge however, I remain comfortable with my long-term hypothesis that the developed world in entering into a Japanification stage. I wrote:
“Japan has struggled with low growth and the risk of deflation for years, and the Coronavirus may have pushed the rest of the developed world onto an accelerated path towards the same outcome. Now obviously this is an oversimplification as each country’s economy is structurally different, but the broader point is still valid: given the demographic trends and current debt levels, developed countries are likely to see low GDP growth rates for a while.
. . .
The lesson from Japan is that when you have high debt levels and low growth, getting creative with monetary and fiscal policy doesn’t usually help. Japan tried 40 different monetary and fiscal programs over the last few decades that all failed to produce meaningful growth. Growth in Japan has been so low for so long that it has undermined their demographics and impacted their culture and national mindsets in permanent ways.“
Once the current fiscal impulse has run its course, I believe the economy will revert to a low growth trajectory given the structural drags from demographics and debt. At that point the government has two options: it can continue to provide fiscal stimulus for growth and push the central bank to finance it (i.e. debt monetization) or it can implement austerity and force the economy into savings mode until all the debt is paid off. We could also get lucky and get a huge productivity boom from a new technological revolution, but as I stated in the article this is unlikely and usually impossible to predict.
If governments choose the first option, they will likely be defaulting on their debt through inflation. With fiscal and monetary policy combined at the hip, people will lose faith in the currency and the debts will be ‘inflated away’ with bond holders getting their principal back in worthless dollars.
If governments choose the second option, we will experience many years of low / contracting growth, high unemployment and strong deflationary pressures.
I continue to recommend gold as a hedge against both scenarios as it has historically preserved purchasing power better than other assets under both inflationary and deflationary regimes. Gold prices have been weak recently as investors have been more focussed on Bitcoin as a store of value and real rates have been rising due to the sell off in treasuries (Gold is theoretically an ‘infinite duration’ asset and tends to have a strong correlation with real interest rates).
I first recommended gold in April last year, and wrote a detailed thesis on gold in late July 2020. Since then GLD (physical gold ETF) is down ~14% and the GDX gold miners index is down ~23%.
I view this weakness to be temporary because 1) while Bitcoin is an attractive alternative to gold, it faces heightened regulatory risks and has a smaller market cap (which means its harder for institutional investors to build a large position without moving the price) and 2) continuous increase in real rates cannot be tolerated by central banks for much longer given high debt burdens.
I think over the long-term investors will own both gold and Bitcoin to diversify their holdings. I also think that inflation expectations will catch up and eventually exceed the recent rise in nominal yields, or the Fed will be forced to implement something along the lines of Yield Curve Control (YCC) to prevent rising real rates from de-railing the fragile economic recovery. A formal announcement of YCC or a continued rapid increase in the Fed’s balance sheet is likely to be very bullish for both gold and bitcoin.
In recent weeks gold seems to have decoupled from rising yields in a sign that maybe the gold market has caught on to what’s happening, or we have hit seller exhaustion. For example, the gold April contract is flat since the beginning of March while 20 year treasury yields have risen roughly 30 bps:
Gold miner breadth also indicates that we are closer to the bottom:
Source: Alex Barrow @ Macro Ops
These data points suggests that patience might be rewarded for the gold bulls sooner vs. later.
The US runs persistent current account deficits (which is bearish for the Dollar), while creditor economies like Germany and Japan run current account surpluses. Therefore, the only way for the US dollar to demonstrate strength against these currencies is through relatively tighter monetary policy.
The most recent cycle of dollar strength started in mid-2014 when the US ended its quantitative easing program. In early 2018 the Fed started quantitative tightening which eventually caused a significant correction in the US stock market. These policies made US monetary policy relatively tight vs. the rest of the developed world and led to the relative strength of the dollar during this period.
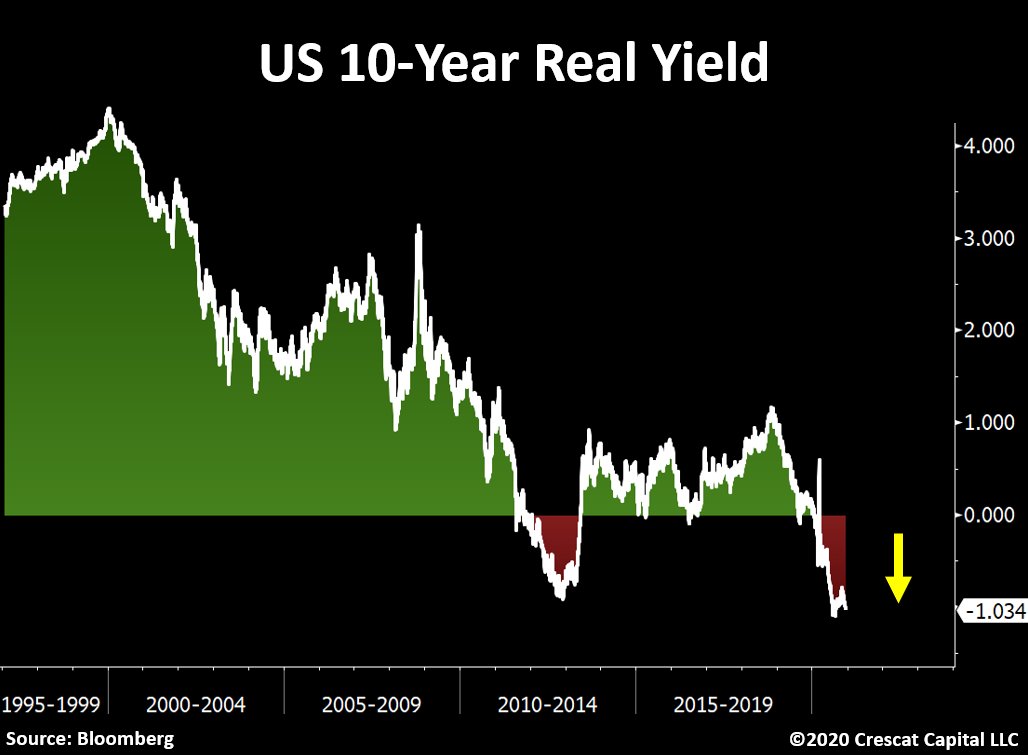
Post-COVID the situation has changed. US monetary and fiscal policy has become looser and the US Dollar has plenty of room to fall. The demand for USD has been fairly stable, but the supply has gone up due to the recent loosening of policy. Now you could point to nominal interest rates and say that despite the looser monetary policy, USTs still offer a better yield vs. say German bunds. But it’s important to keep in mind that on a real / inflation adjusted basis USTs are now also yielding <0% and with the Fed likely to increase its asset purchases, real yields are unlikely to rise significantly from here.
Since Fed policy is going to remain loose for the foreseeable future, we could be entering into a structural bear market for the dollar in the coming years. The US Net International Investment Position (NIIP) is now over -60% of GDP, which is nearly triple the level at the beginning of the last dollar bear market (2005). NIIP is defined as the difference between the value of foreign assets owned by the U.S. and U.S. assets owned by foreigners. What this means is that the world owns a lot more of the US, than the US owns of the world. And if lots of people try to leave the market the dollar will go down significantly.
Source: U.S. Bureau of Economic Analysis
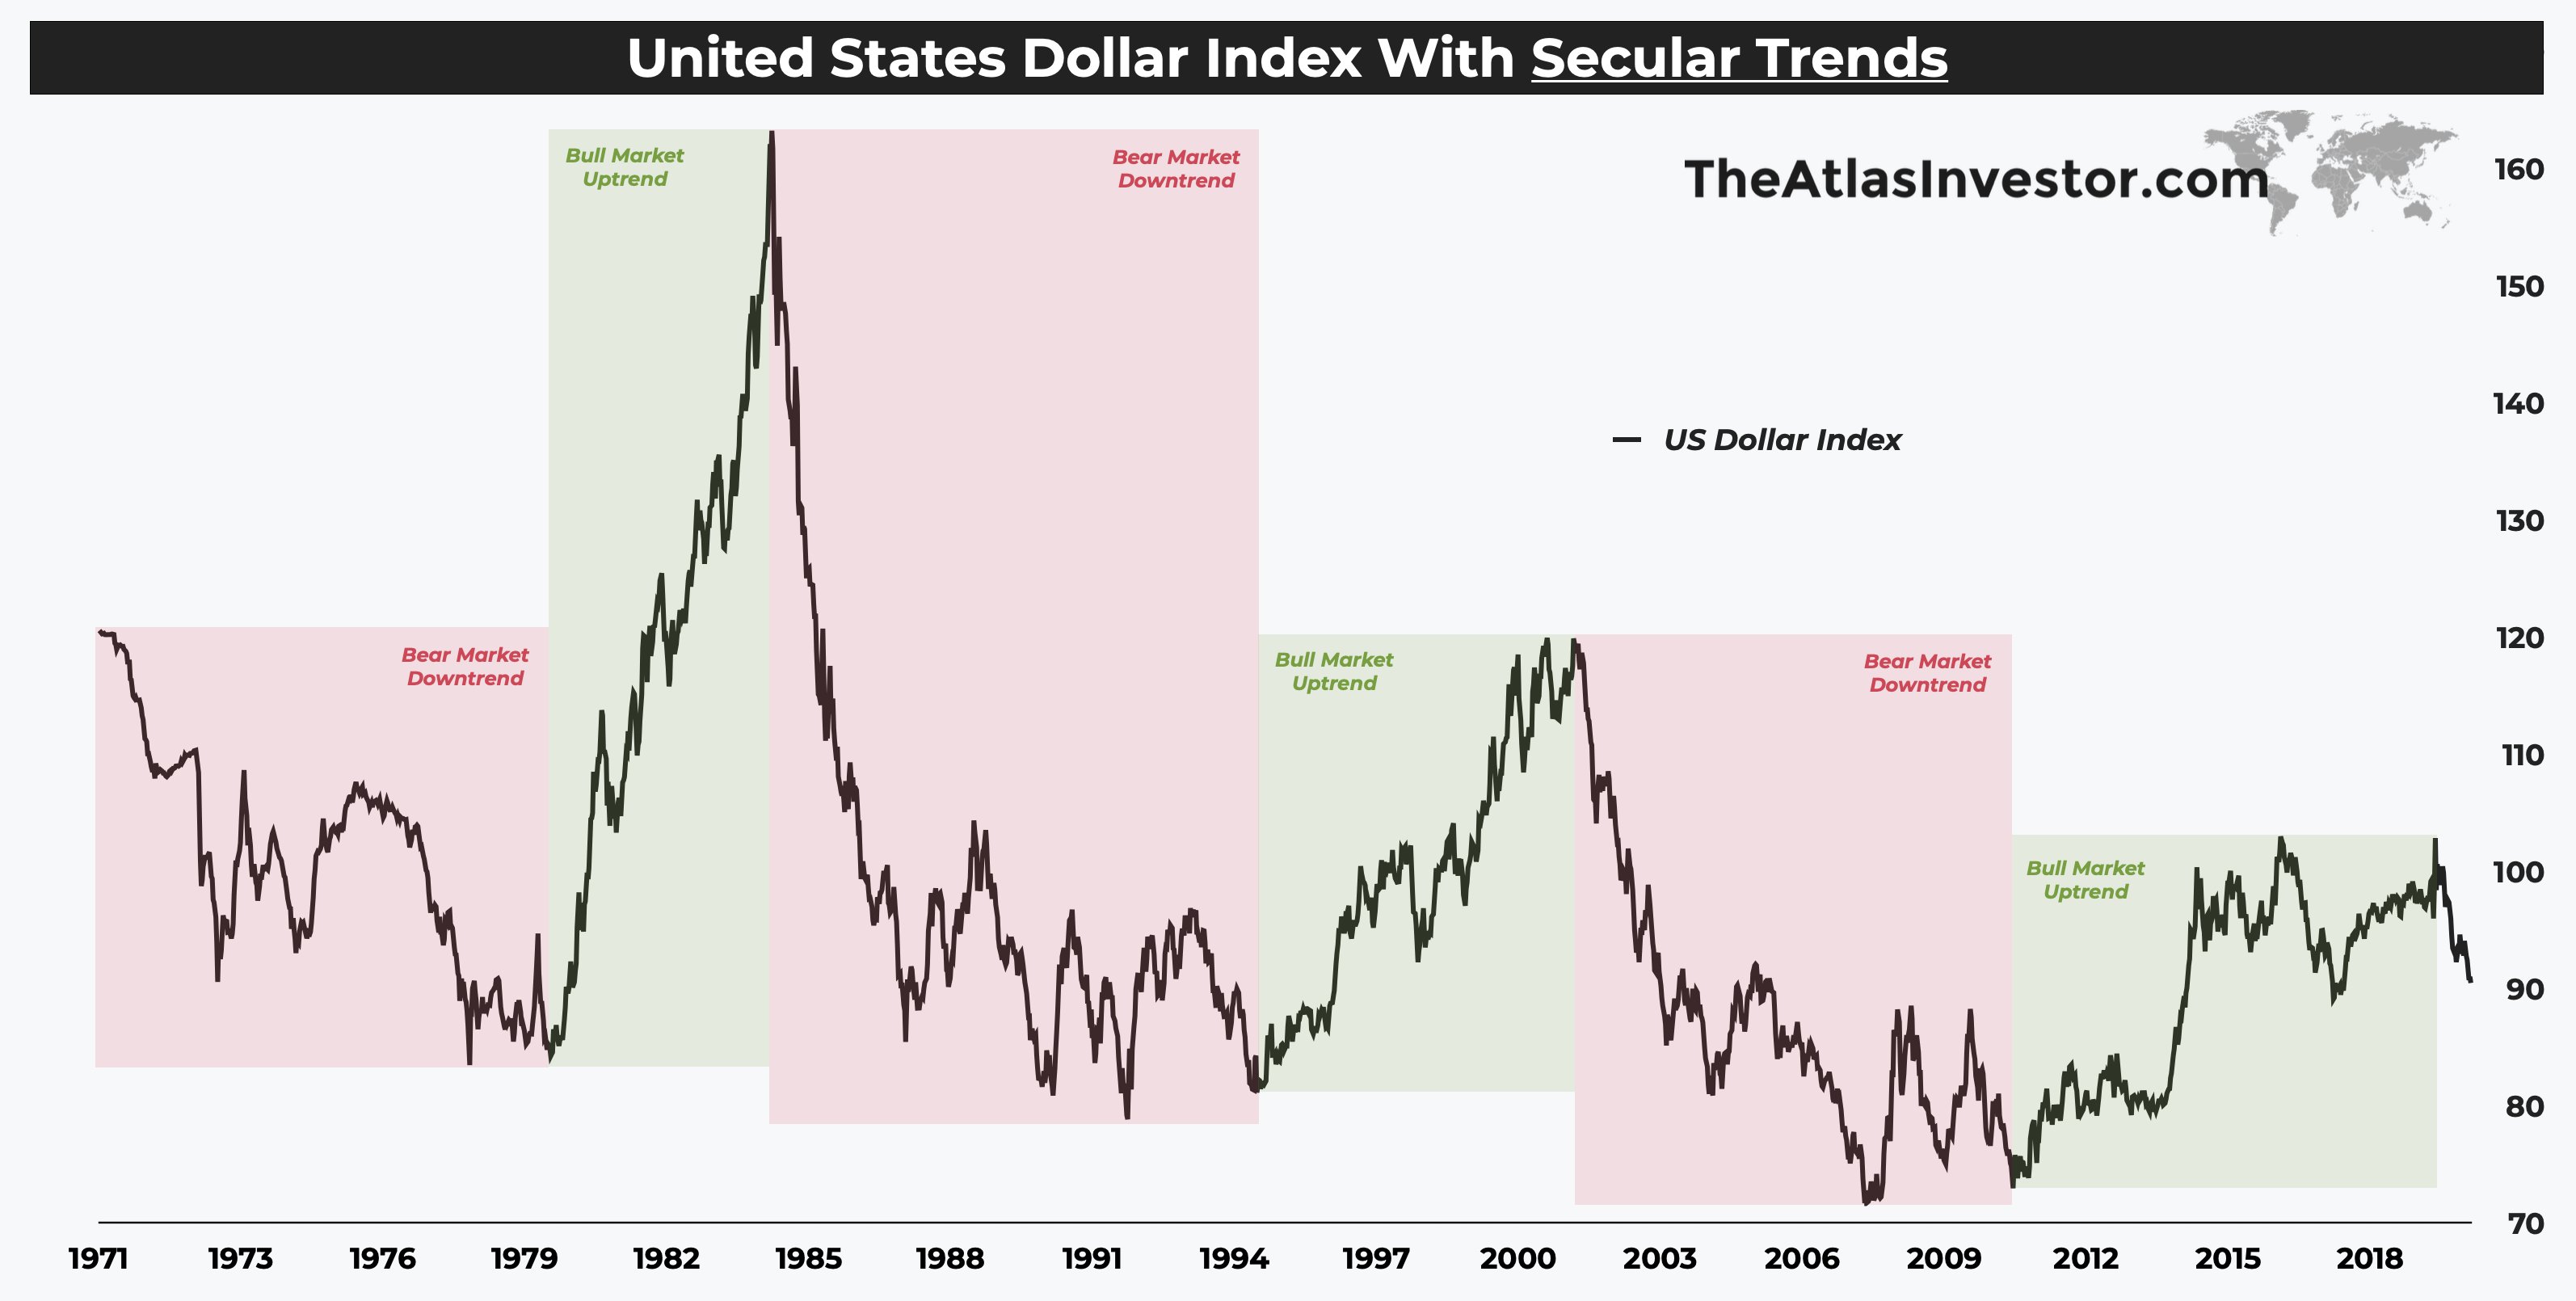
If you look at the US Dollar from a historical lens it tends to move in multi-year bull and bear cycles that highlight these structural shifts in monetary policy and trade regimes over the years. Since 1971 (when Nixon removed the dollar from the gold standard) the dollar index has had 3 secular bull and bear markets:
Source: TheAtlasInvestor.com
Looking at the USD vs. Euro shows a similar picture.
Source: Currency Research Associates LLC
These secular shifts have important implications for asset allocation. If we are indeed in the beginnings of a bear market in the dollar, it will likely last at least another 7-10 years and investors who are over-exposed to USD denominated assets will have to reallocate capital. As investors do the math around FX losses, they will start to re-allocate their portfolios to asset classes such as emerging market stocks and commodities which benefit from a weaker Dollar.
Concluding Thoughts
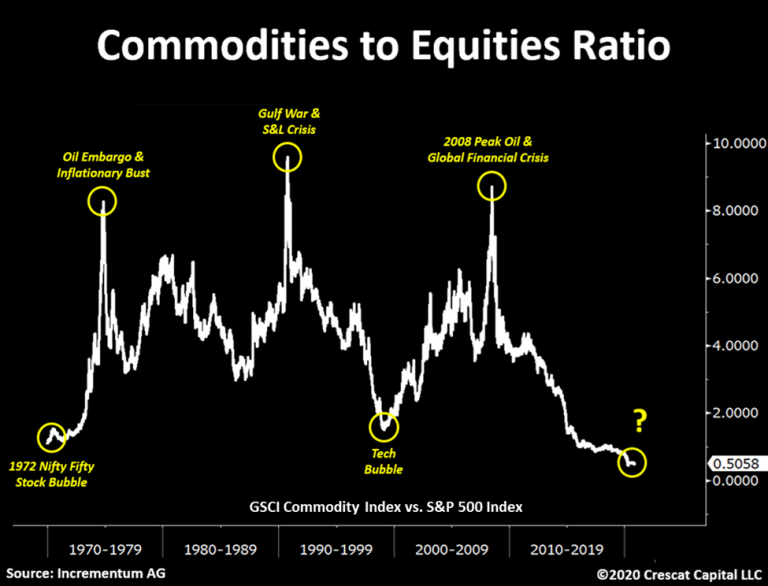
Markets are cyclical. Today, US stocks trade at record high valuations while commodities are historically cheap. Due to the unprecedented monetary environment we are in, I think the current equity market bubble could continue longer than most expect. I certainly wouldn’t recommend something risky like shorting US equities. However I also believe that risk / reward for owning USD denominated bonds and equities is steadily deteriorating.
Source: Crescat Capital
Investors should consider reallocating capital towards commodities and emerging market stocks. Both sectors remain deeply undervalued and underinvested.
I have written extensively on oil and gas and I continue to believe that the energy sector will be a primary beneficiary of the next macro / investment cycle. Investors continue to be obsessed by peak demand theories but I believe that peak supply is going to hit faster and sooner, catching the majority of investors off guard. In fact if it wasn’t for US shale (another Fed induced bubble!) the market would already be in a structural deficit.
Source: GS Research
With sentiment extremely negative for the sector, capital access has dried up and oil & gas companies have been forced to cancel all major longer-term exploration and production plans. 6 years of under-investment are about to the hit the world’s oil supplies over the next few years creating one of the best investment opportunities in the sector since the last decade.
Source: GS Research
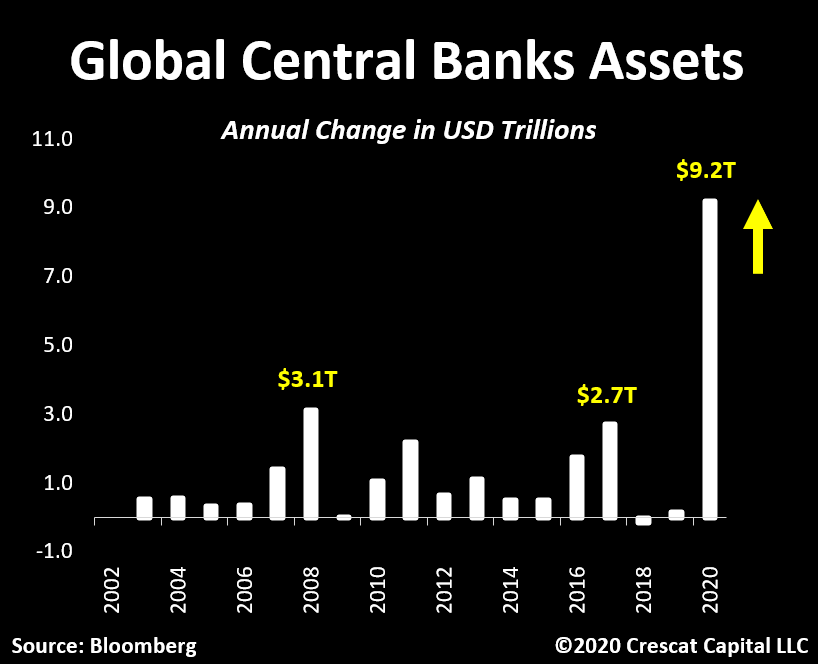
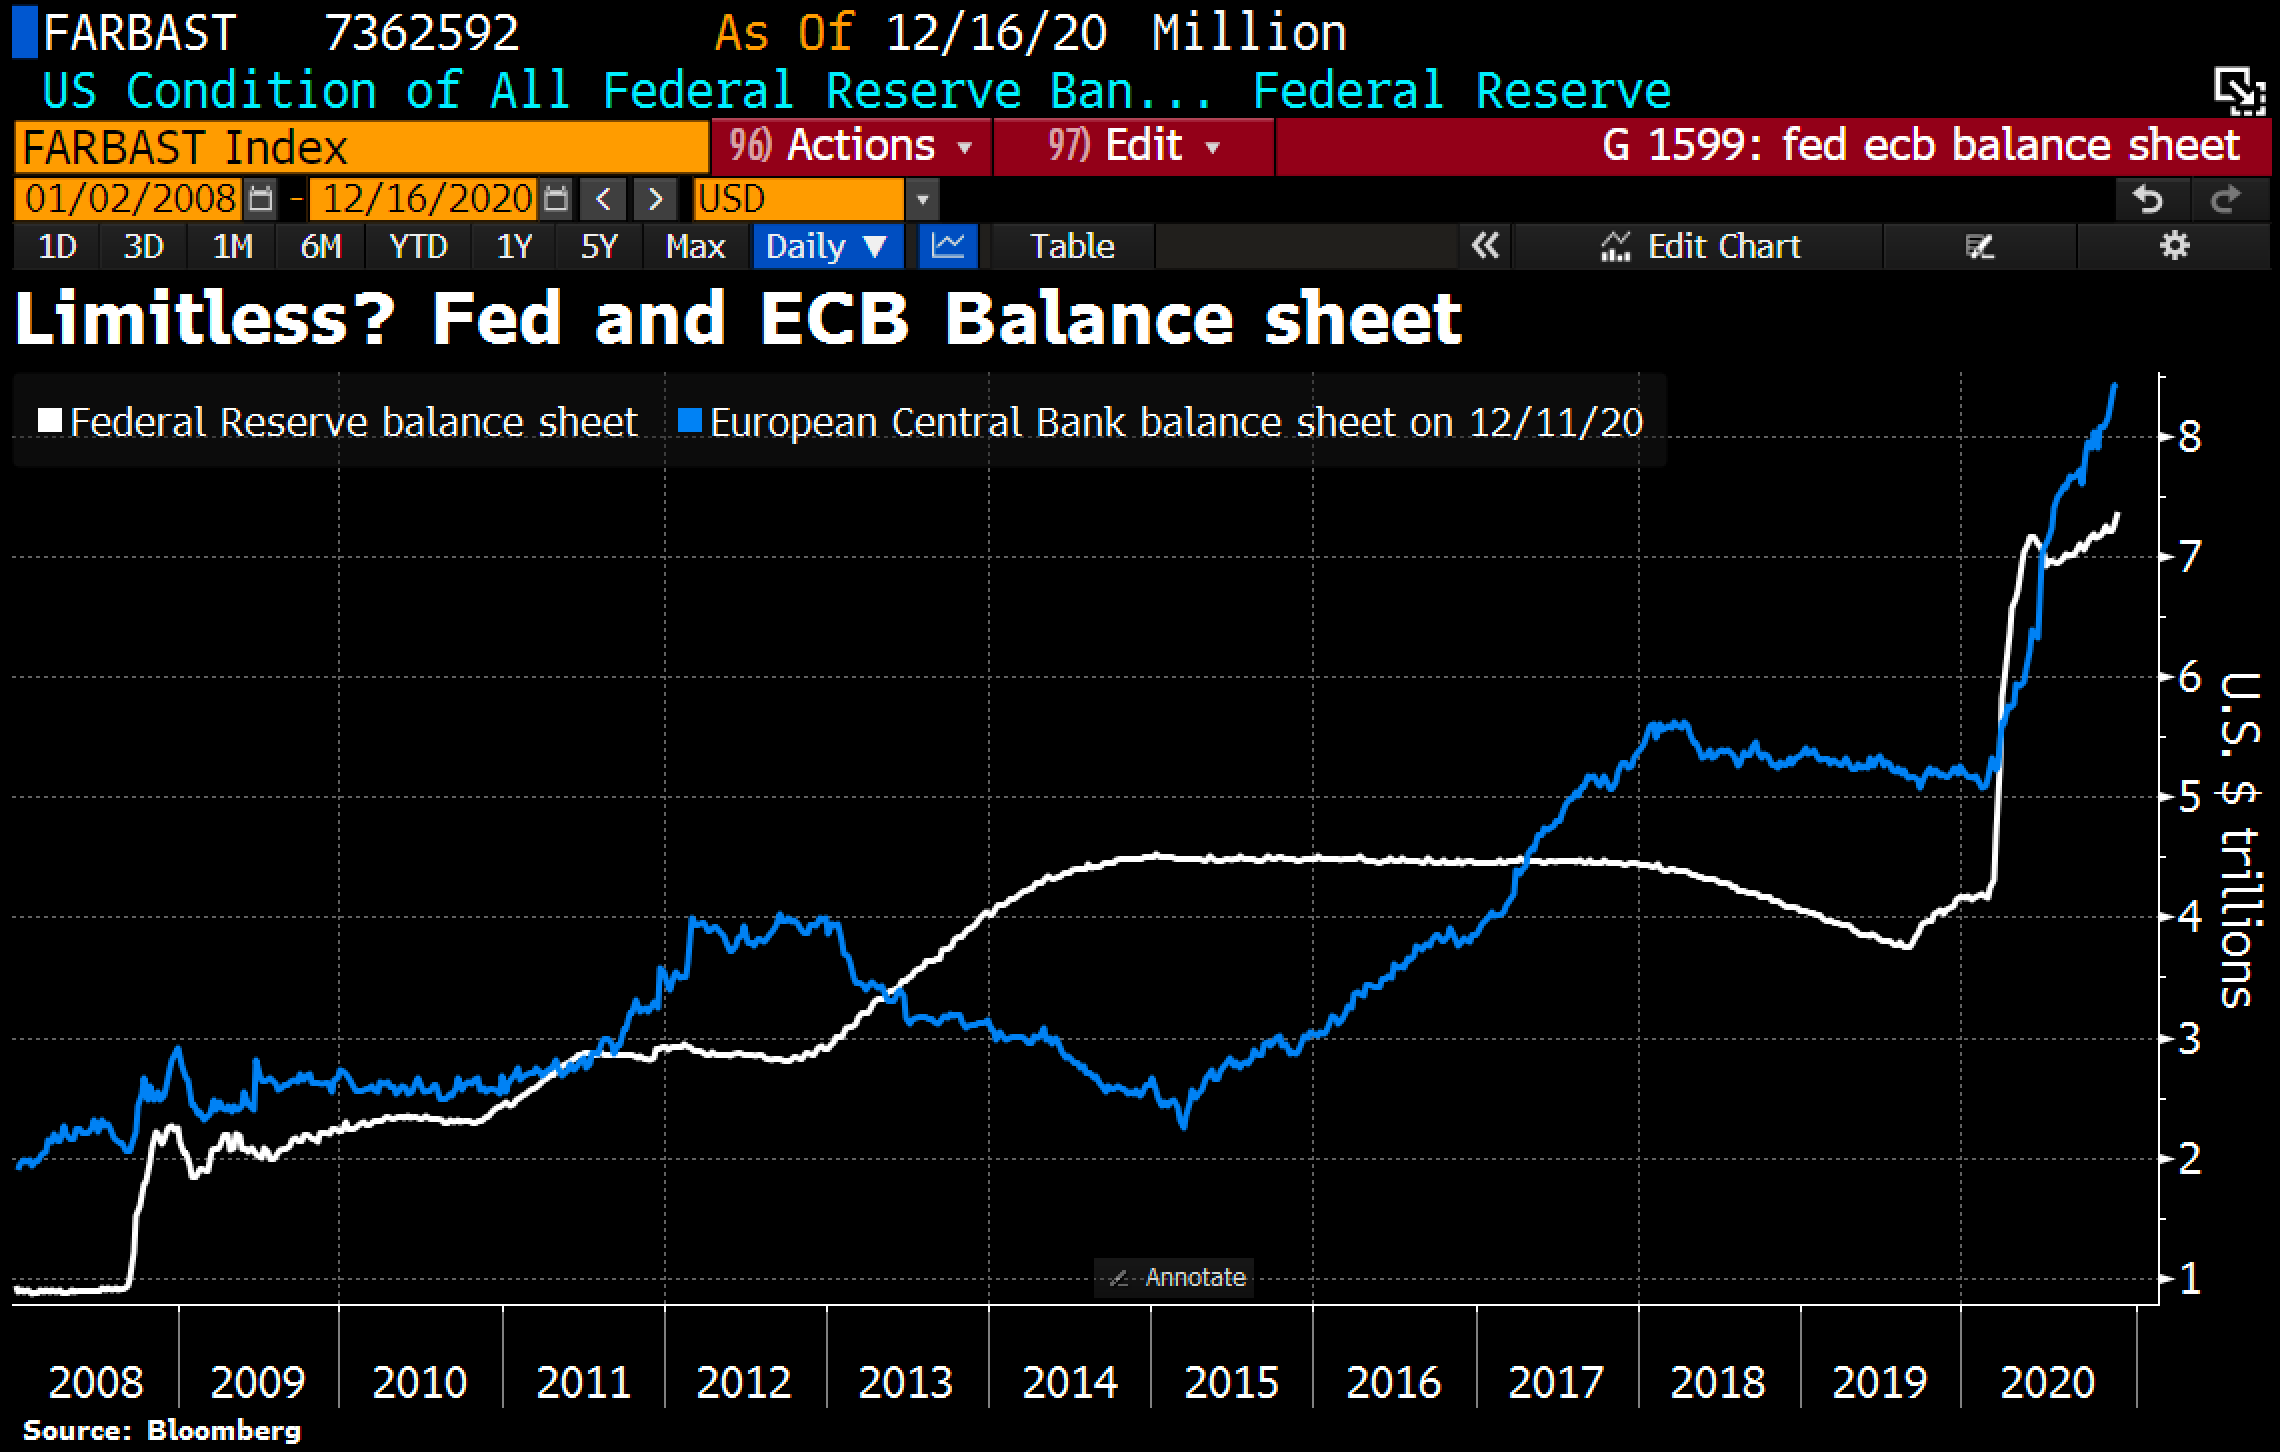
Finally, I continue to have an allocation to gold and silver as I believe precious metals are starting a new secular bull market in response to monetary debasement. The big financial story of 2020 has been the record quantities of money printed by central banks to finance budget deficits and shore up liquidity.
Source: Crescat Capital
As this money starts trickling into the real economy (esp. with additional fiscal stimulus), inflation expectations are rising. With nominal rates stuck at the lower bound, bonds and cash are becoming increasingly unattractive as stores of value. Gold is one of the oldest currencies in the world and should attract more investors as an alternative safe haven. As I wrote in my detailed piece on the gold thesis, the metal remains extremely under-owned in most Western investment portfolios.
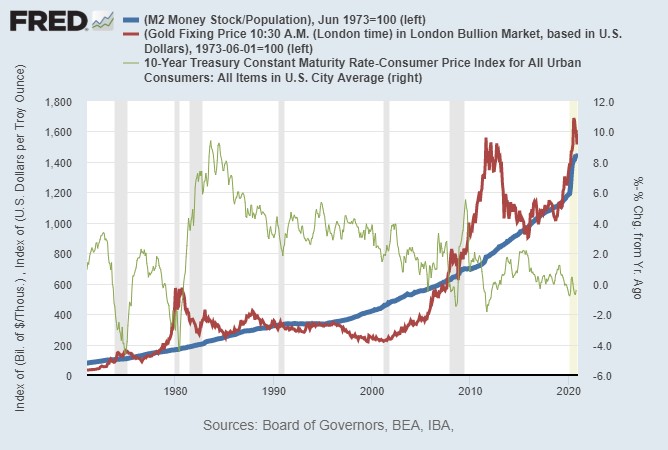
Over the long term Gold shows strong correlation to real rates (inverse) and M2 (money supply), both of which are firmly set in their trajectories given where we are in the long-term debt cycle.
Source: Gold-Eagle.com
A closer look at the gold chart reveals that we could be on the cusp of a major secular bull market, similar to the breakout in 2005. From 2005 to 2012 gold appreciated ~4.5x. A similar move would take gold prices well above $8000 / oz.
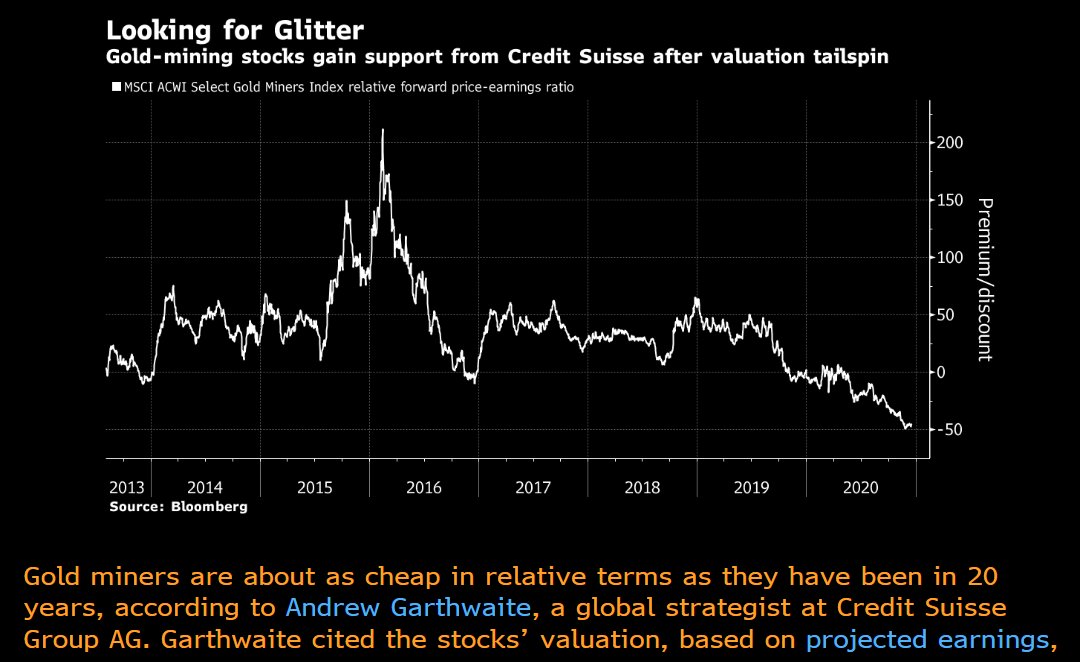
Source: TradingView
In the meantime, gold miners are the cheapest they have ever been in 20 years on a forward P/E basis. Looks like an asymmetric risk / reward profile.
I wrote two pieces about the Coronavirus earlier this year. The first piece written on March 2nd talked about how the market had underestimated the impact of the virus and the mishandling of the situation by politicians. However, I ended on a sanguine note suggesting that the market sell off presented a buying opportunity and that the crisis would likely abate in 3-6 months as countries would manage to ‘flatten the curve’.
On March 21 I wrote in a more cautionary tone, warning that the virus could cause longer-lasting social and economic impacts. By this time I had done more reading on the topic and was no longer as convinced that things would return to normal within a few months. I warned about the risk of secondary / tertiary outbreaks. I also wrote about the impact of the lockdowns on small businesses in particular and highlighted the possibility of political instability and social unrest.
6 days after I published this blog post, the US government addressed a number of these concerns by passing into law an unprecedented $2.2 Trillion stimulus packaged titled the “CARES Act”. The stimulus bill offered direct payments to individuals and families to help cover their daily expenses. Small businesses and certain targeted industries received aid in the form of forgivable loans to help them keep employees on payroll. State and Local governments also received funding to help combat the virus.
While the stimulus has certainly been welcome news for the general population, it has benefited some more than others. The stock market, the bond market and the housing market are all at all-time-highs, meaning that if you’re an asset owner you have seen your net worth increase substantially during this period. On the other hand if you live pay-check to pay-check, you are likely suffering from low wages, job insecurity and under-employment. This has led several people to refer to the economic recovery as the “K-shaped” recovery; i.e. one that is exacerbating already high levels of inequality.
The longer-term implications of the stimulus bill for both asset prices and the economy is not well understood by the recipients of this money, nor the mainstream media. Economics tells us there is no such thing as a free lunch, and America’s (as well as most of the developed world’s) current fiscal trajectory and associated debt binge is going to have important implications for the nation’s future economic growth and prosperity. I talked about this in detail in my big picture piece titled “A Possible Path Forward” on April 30th. I discussed several examples of historical debt cycles to try form a hypothesis on how the current cycle is likely to play out.
While we might see an uptick in economic growth next year due to pent up demand, I continue to believe that the longer-term picture for economic growth remains weak. Due to a combination of high debt levels, flattening productivity and deteriorating demographics, a secular stagnation is most likely on the cards for most of the developed world. And governments, as they have always done in history, are likely to respond to this with even more (and increasingly creative forms of) stimulus. This will ultimately result in debt monetization, monetary debasement and potentially hyperinflation.
In order to protect one’s wealth against this inevitable currency debasement, it’s important to own (directly or have indirect exposure to the value of) hard assets such as precious metals, land and commodities etc. I wrote a detailed piece on how gold can serve as an effective hedge against this scenario and why it should be a part of every investor’s arsenal. Bitcoin is emerging as another alternative that is worth exploring.
Equities– The New Inflation
Before the end of the debt cycle, we are likely to see the equity bubble peak. Over the last 10-years, the S&P500 has returned an annualized return of ~11.5% while the NASDAQ has returned ~20%. These are well above the long-term historical average equity returns (history teaches us that asset-class returns are mean-reverting). Valuations are also close to their all-time peak.
One could argue that current valuations are justified given the record low interest rates. However, with interest rates close to their lower bound, one can also argue that there is not much more that be squeezed out of equity valuations based on lower discount rates alone.
The other fundamental driver of equity valuations is earnings or cash flow growth. Organic growth (primarily tech sector), margin expansion, M&A and share buybacks are the primary earnings growth drivers.
Organic growth in the tech sector could start to slow as the big tech companies take increasing share of their total addressable markets. Also, with competition steadily increasing, so is the marginal cost of acquiring new customers. COVID-19 has also pulled forward a significant amount of growth for certain tech sub-sectors like e-commerce, online food delivery and enterprise software.
Margin expansion is reaching its limits as years of high M&A volumes have led to major consolidation in most sectors, and further consolidation opportunities are limited. In fact, recent political developments point to increased regulation, corporate taxes and de-globalization which will exert downward pressure on profitability.
With these fundamental headwinds, how can we make sense of the seemingly never-ending stock market rally? One explanation is money printing. The Fed is currently buying $120bn worth of mortgage backed securities and treasuries every month. A lot of that liquidity flows into the stock market.
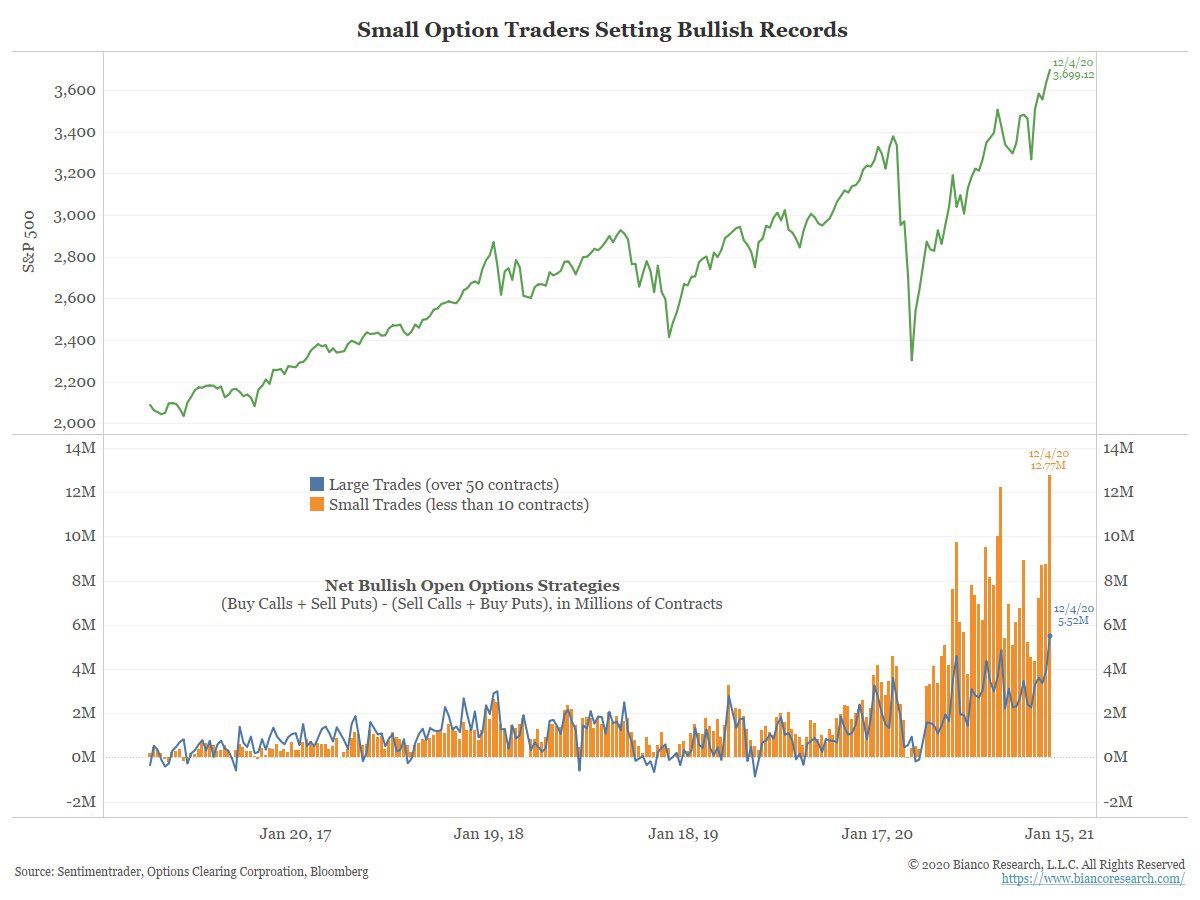
The other explanation is irrational exuberance amongst retail investors who are buying stocks mostly on a speculative basis. There are multiple data points from this year that point to this. Retail trading and call option buying volumes for example have been at record levels. Even some large institutions like SoftBank have been adding fuel to the speculative frenzy, buying billions of dollars worth of naked call options on technology stocks.
Receptivity towards speculative investments such as SPACs and money-losing IPOs is another sign. The ratio of U.S. IPOs with negative vs. positive net income in the past year dwarfs even the dot-com bubble peak.
Meanwhile hedging remains out of fashion as evidenced by record low put-call ratios. Whatever investors are worried about, a falling equity market is definitely not it. Thanks to fed intervention and recent price action, most market participants have been psychologically conditioned to expect higher stock prices. As a result every dip gets bought, and equity valuations veer farther and farther from underlying fundamentals with every rally.
It seems to me that the equity market has come to reflect the inflation that many have feared in response to the unprecedented expansion of central bank balance sheets that started post the GFC. Instead of getting a ‘CPI inflation’ shock where we would have experienced rising prices for daily goods and services, we are instead having to chase every dollar of corporate earnings higher in terms of valuation multiple in the stock market. Equity valuations have become a reflection of monetary debasement rather than the value of ownership stakes in the underlying businesses.
None of this means that we will have a bear market in stocks anytime soon. In fact, given the continuous money printing, low interest rates and trillions of dollars of capital still on the sidelines that is waiting to be put to work, the equity market bubble could become even more extreme. However this does mean that if you have a large naked or leveraged exposure to equities you are playing with fire.
Asset bubbles don’t always need a catalyst to blow up. Sometimes they collapse under their own weight. A correction when it happens, could come without warning and be deeper and faster than most expect due to the lack of fundamental / valuation support and one-sided positioning. During the 350% run in the NASDAQ during 1998-99, there were plenty of 10 – 20% corrections. If you’re long options for example it’s important to to buy enough time to ride through these corrections, or alternatively own some hedges.
To experience something more prolonged than a temporary correction (i.e. a bear market), we would need a Fed tightening cycle. All the recent bear markets in equities were the result of Fed tightening which led to a flattening or inverted yield curve and drained liquidity from the market. The Fed did this in response to rising inflation expectations. However, this time around the Fed has made it clear that it is willing to let inflation run above target. Translation: the secular bull market in equities could go on as long as inflation doesn’t go so far above target that it forces the Fed’s hand. After that point, we are likely to get a mean reversion in returns. Equities could then underperform for an extended period of time, similar to the 1970s.
Source: The MacroTourist
Bonds – “Return-Free” Risk
If you buy a 10-year US treasury bond today and hold it to maturity, current inflation expectations suggest that you will lose close to 1% a year. Yet investors continue to buy record amounts of US Treasuries to fund America’s never-ending deficits.
This is not a problem limited to the US. The vortex of negative yielding debt grows by the day, currently close to $18 trillion outstanding. As I stated earlier pretty much all the developed world is in the same predicament. Due to record-high debt levels, nominal interest rates are stuck at the lower bound and lenders (i.e. bond buyers) are essentially guaranteed a negative return in real-terms unless the world falls into a deep deflation or nominal rates continue lower into negative territory. Both those outcomes are unlikely as the central banks won’t allow it.
A deflationary spiral is a central banker’s worst nightmare and deflationary forces will push policymakers towards even more money printing, and potentially enacting something along the lines of Modern Monetary Theory (MMT) to spark inflation. As I stated earlier, the Fed has indicated repeatedly that they see no signs of inflationary risks and are even willing to let inflation run higher than their 2% target for a while as they think about inflation on a longer-term average basis.
With the developed world increasingly pushing the pedal on fiscal (on top of monetary) stimulus, the stage is set for a pick up in money velocity and inflation expectations. For the first time since central banks started structurally expanding their balance sheets post the GFC, it appears the money being printed could end up in the hands of the average person (as opposed to the owners of assets) and start circulating through the real economy causing inflation expectations to rise significantly. This would be further exacerbated through the release of pent-up demand in a post COVID world which is supply-chain constrained.
With nominal yields stuck at the lower bound, any increase in inflation expectations will quickly deepen the losses for investors buying bonds today. The US dollar has also been steadily weakening, creating a double whammy for foreign holders of US Treasuries. It’s important to remember that the bond market is many multiples the size of the equity markets and the exits from this trade are narrow.
If losses on bond positions start to pile up, the global financial system could break under the strain of investors trying to get out. As we learned from the GFC, any disruption to the flow of credit / bond markets unravels the global economic system quickly. The pension system could also unravel. Pension funding relies on certain assumptions regarding future equity and fixed income returns that could prove to be significantly higher than reality. This is a systemic risk that most investors seem to be ignoring at the moment.
I’ve discussed in detail in several posts how the lack of capital investment in the energy sector is going to lead to a strong bull market in oil in the coming years. I believe the thesis will only get stronger with Biden as president.
The Democrats have been leaning strongly towards anti-fossil fuel policies, and Biden has mentioned several times that he wants to ‘phase out’ oil and eliminate fracking (which accounts for the majority of the US Shale sector) during his campaign.
Based on what’s been said publicly, the Biden energy policy will be centered around the following three pillars, all of which will curtail future oil production growth in the US:
– Federal drilling ban
-Limiting natural gas flaring
– Slowing down approvals for energy infrastructure/ pipelines
Platts estimates that a Federal drilling ban alone could impact US oil production by 2mm b/d over the next 5 years. This 2mm b/d will be desperately needed post-COVID given the declines in Non-OPEC ex-US production. The US oil sector has already been suffering from capital starvation as investors have fled the sector, and the new regulations could mean that US oil production may never recover its peak level of 13mm b/d.
What are the implications of this for supply / demand and oil prices? We can look at some of the post-COVID projections to try and quantify the impact.
Most of the big energy analytics firms were predicting an oil market deficit in 2020, pre-COVID. This was with US production estimated at 13.4mm b/d. It appears that US production is now likely to top out at around 11 mm/d.
If we look at oil demand growth over the last 10-years, it’s averaged +1.5mm b/d. But because of COVID, a number of folks are arguing for structurally lower demand growth going forward (more people permanently working from home and less travel overall etc.).
I disagree with this view and have a more bullish outlook on oil demand recovery. I believe there will be strong pent-up demand for travel post-COVID. Also, as GDP per capita grows in places like China and India, the expanding middle class population in these countries will start buying their first cars / motorcycles / airplane tickets which will increase oil demand significantly.
I also believe strongly that electric vehicles are not going to be able to replace conventional vehicles in any significant way to meet this increasing demand over the next 4-5 years (I will write more on this in a follow-up blog post).
However, for the purpose of this analysis let’s be conservative. Let’s assume the IEA, which has historically always underestimated demand growth, is correct this time in their assumption of 750k b/d oil demand growth in the post-COVID era.
2019 oil demand was around 100.2mm /d. 2020 is forecasted to be around 93.3mmb/d. If I forecast oil demand recovery back to 100mm b/d by 2022, and then 750k b/d of growth from there onwards I get 102.5 mm b/d of oil demand for 2025.
Less: 2021 – 2025 US Supply Growth: -0.5mm b/d (assuming production caps out at 11 mm b/d)
2021 – 2025 Call on ROPEC: +10mm b/d
Based on this math, even in a draconian oil demand recovery scenario, OPEC would have to increase production by 10mm b/d over the next 5-years to keep the market in balance! Is this a realistic ask of OPEC?
A few points to consider:
1/ Including Iran and Venezuela, OPEC spare capacity is ‘theoretically’ ~9mm b/d at the moment. Realistically speaking however, Iran and Venezuela’s ability to increase production will be limited over the next year or two (even if sanctions are removed) because of the severe lack of investment in their oil production infrastructure over the last few years
2/ It is also not realistic to assume that the rest of OPEC can produce at maximum capacity for an extended period of time as this would put enormous strain on the oil wells and potentially lower ultimate oil recovery. For reference, OPEC produced close to 32mm b/d during the 2018 ‘surge’, which would imply a 6mm b/d capacity (ex-Iran and Venezuela). Assuming the Biden administration removes sanctions on both countries (which is not straightforward by any means), we can maybe add +1-2mm b/d to that number. So we are still short of the 10mm b/d requirement by some margin.
3/ The OPEC economies have been devastated as a result of the recent oil price declines and will not be able to recover the damage to their fiscal situation unless oil prices are above $80+ for an extended period of time. This means that even if they theoretically had the ability to balance the market, their desire to do so would be limited and they are likely to keep production cuts in place for an extended period of time
If we assume a more realistic oil demand recovery scenario where demand recovers to 100mm b/d by 2022 and then grows at the historical rate of +1.5mm b/d thereafter, then in 2025 total oil demand will be ~104.8mm b/d. The math will then look like this:
Less: 2021 – 2025 US Supply Growth: -1.5mm b/d (assuming production caps out at 12 mm b/d)
2021 – 2025 Call on ROPEC: +11.5mm b/d
In this case I’ve assumed that US Shale is able to recover to 12mm b/d given that the larger demand swing might allow the Shale sector to attract incremental capital and return to some semblance of growth in the post-COVID world.
This is the more likely scenario in my opinion, and results in a supply deficit so large that demand destruction would be the only way to balance the market. If we look at oil price over long periods of time, demand destruction usually starts when oil consumption starts hitting 5% of GDP. This would equate to oil prices in the $120 – $150+ range.
A couple of months ago, I wrote about the different stages of oil market recovery and how to play them. Specifically I wrote that we were on the cusp of moving from phase 1 to phase 2, where oil inventories would start normalizing in response to supply reductions and demand normalization in H2 2020. I wrote:
The second phase of the recovery will involve the market moving into deficit and stocks starting to draw down consistently. During this phase, spot prices will again be capped due to the excess inventory overhang. But as the market slips into deficit, we could see spot go above the cash costs (maybe $30 – $40 / bbl) to incentivize some of the lower marginal cost supplies to come online and take market share. This should start happening as soon as H2 2020, assuming the global economy starts re-opening without any glitches. The key data to watch during this phase will be inventory draws and the shape of the futures curve which should be flat or going into backwardation to incentivize oil to come out of storage.
My oil price forecast was surprisingly accurate as we remain rangebound in the $30 – $40 range for now. Let’s looks the data I reference previously to see how we’re tracking.
Inventories are starting to normalize (both oil on water, and onshore US stocks):
Source: HFI Research
Source: Open Square Capital
And the Brent futures curve had started to flatten, but the contango started steepening again in July as China imports got weaker:
Source: Barchart.com
(Note: Chart shows Brent Dec ’20 futures minus Jan ’21 futures; a lower value implies steepening of the contango which is bearish)
So the report card is mixed. While oil on water has normalized, we are still not out of the woods with respect to US onshore inventories and the Brent futures curve continues to indicate a weak market.
COVID cases starting to peak once again in Europe and North America are another cause for concern. If countries decide to pare back the re-opening process that would be bearish for oil demand and overall sentiment. This means that we could stay in phase 2 for longer.
While I’m a strong believer in the longer-term bull thesis for oil, it’s best to be cautious and stay on the sidelines at the moment. With no clarity on vaccine timelines, US elections right around the corner and uncertainty regarding how bad the next phase of COVID will get, it’s probably best to observe how things play out and wait for more data points to confirm that phase 2 of the oil recovery is about to transition to phase 3. The next couple of months should offer more clarity.
In my April blog post titled ‘The Possible Path Forward’, I wrote a brief blurb on why an allocation to gold made a lot of sense in the current environment. In this post I want to elaborate more on the thesis by defining more precisely what I think gold represents, and the key macro drivers impacting its price.
Despite the strong rally in gold recently (+15% since my original post), I believe prices are going much higher than most people expect.
The Case for Gold
Often looked upon as a relic of the barbaric ages, gold is usually shunned by institutional investors who consider it to be a speculative instrument better suited for retail investors or gold ‘bugs’. The anti-gold argument goes something like this: It’s a non-productive asset whose value is determined purely by investor sentiment / perception. One can only profit from gold as long as someone is willing to purchase it at a higher price at some point in the future. And while this is true for all financial assets, the future price of ‘productive’ financial assets is backed by the present value of the cash flows they generate. In the case of gold, it just ‘sits there’.
Unfortunately, this line of thinking misses the true essence of gold. I believe that gold can be incredibly powerful in a portfolio during certain macroeconomic regimes / environments. And I believe that due to COVID-19 and the ensuing fiscal and monetary stimulus, we have entered such an environment. The fact that gold remains deeply misunderstood and under-owned therefore represents an opportunity.
At its core, gold is a currency. It’s therefore incorrect to compare gold to stocks or other financial assets that generate cash flow. The best way to think about gold is as a means of storing value (which is true of all currencies), especially during times of uncertainty.
Historically, gold prices have been extremely volatile and most investors have preferred holding cash, or treasury bonds for this purpose. But during a few times in history, a confluence of economic, political and monetary circumstances has made the value of gold shine brighter than the traditional alternatives.
One such circumstance is when trust in central banks and governments starts eroding. Both cash and treasury bonds are backed by centralized institutions with opaque power structures that are often incentivized to find short-term solutions to economic and political problems, at the expense of long-term outcomes. History warns us that putting one’s complete faith and trust in these institutions and their short-termism can occasionally lead to disastrous results (e.g. sovereign debt defaults, hyperinflation etc.). This creates demand for an alternative safe asset. Preferably one that lies outside of the financial system.
My sixth sense tells me that we are in a situation where trust in centralized authorities is fast eroding, both in the developing and developed worlds. Government response to COVID-19 and the resulting economic damage has started to make people feel vulnerable in ways they maybe haven’t in more than a century. Populism, civil disorder and geopolitical tensions are all on the rise.
Despite the extraordinary measures governments have taken to backstop the economy and inject liquidity into the financial markets, a deep sense of unease remains. Perhaps at a fundamental level most people realize that there is no such thing as a free lunch in life. If free lunches don’t apply to our daily lives, why should they apply to governments and other institutions? If every problem could be solved by taking on more debt and printing more money, then we should have effectively de-risked the entire global economy from any kind of downward shock.
It’s not the first time people have asked these questions and felt uneasy about programs such as quantitative easing. Starting 2009, gold prices appreciated significantly (reaching as high as $1900 / oz) as investors expected that the cost of this seemingly free lunch (in the form of Fed’s money printing) would be higher inflation down the road. Inflation would make holding cash and bonds extremely unattractive, and this led to the rise of gold.
However, the inflation that people had feared never materialized. Asset prices continued to appreciate, but CPI inflation remained absent. The US Dollar remained strong and bonds continued to perform well as a hedge against macro uncertainty. As economic growth continued, faith in the authorities was somewhat restored and there was an expectation that the Fed would eventually normalize both it’s balance sheet and interest rates. Gold slowly lost it’s shine and entered into a brutal ~6-year bear market, bottom’ing at around $1050 in late 2016 / early 2016 and then trading sideways for another 3 years.
Towards the end of the decade, everyone had come to accept that quantitative easing was not inflationary, and perhaps this meant that gold could once again be relegated to the archives of financial history. But then something interesting happened. In late 2018 the Fed tried to normalize monetary policy, and the markets puked. If quantitative easing and low interest rates had really been so successful in generating sustainable economic growth, then surely the markets should be able to perform well without the aid of central bank stimulus?
It turned out the answer was a resounding ‘no’. As the Fed raised rates, the yield curve started inverting (predicting that monetary policy normalization would lead to a recession) and stocks dropped sharply.
Then in 2019, global growth began to slow. It was becoming clear that monetary policy normalization was a myth, and that things were likely headed in the complete opposite direction: central banks were going to have to issue more stimulus to reflate the global economy. In the summer of 2019, realizing that central bankers had been painted into a corner, gold started breaking out of it’s downtrend.
With interest rates already starting from a very low level, people wondered if the authorities were running out of ammunition for the next big economic contraction. They didn’t have to wait long to see how this scenario would play out.
Thanks to COVID-19 the future paths for fiscal and monetary policy, which were already shifting in favour of gold, are now in the ‘red zone’: we have reached a ‘Keynesian tipping point’ of no return.
Some would argue that this view is short-sighted and that a strong economic recovery post-COVID could allow governments to de-leverage. But as I have stated in previous blog posts, I believe that a combination of deteriorating demographics and productivity headwinds will keep economic growth low and fiscal deficits high even in a steady state economic environment. This is true for the US, Europe and most of the developed world (I called it the ‘Japanification’ of developed economies).
If you are wondering why the US 10-year treasury is yielding 0.6%, and why trillions of dollars worth of sovereign debt is trading at negative yields, this is the answer. Central bankers have been snookered: they can’t raise rates or stop buying government bonds without blowing up the world economy.
So what does this all mean, and how is it relevant for gold? I think one of the key takeaways from the current scenario is that that the risk-reward of holding cash or bonds as a store of value has never been worse. The value of cash is eroding quickly as central banks increase money supply at prodigious rates to fund ever persistent deficits. And bonds offer an awful asymmetric payoff profile; with interest rates already at the lower bound and stuck there for the foreseeable future, the upside in bonds is limited while there is potentially unlimited downside under an inflationary scenario.
I also think that the risk of CPI inflation (which never materialized post-GFC) is greater this time around. The reason for this is two- fold: 1) the state of the banking sector and 2) state of globalization. In 2009, banks were poorly capitalized and looking to preserve liquidity. As a result, Fed money printing was not accompanied by a proportionate increase in lending and the velocity of money and inflation remained in check. Additionally, globalization (in particular China) was a strong deflationary force as the cost of production for goods / services declined rapidly due to outsourcing.
In the current crisis, banks are adequately capitalized and more likely to extend credit. Also, globalization has gone into reverse thanks to the US-China trade-war and the supply chain susceptibilities exposed by COVID-19. Both of these factors are strongly inflationary.
We have now arrived at the bull-case for gold:
Debt levels have exploded globally
Due to a combination of demographics, low growth and bloated welfare state budgets, debt levels will continue increasing in the developed world for as far as the eye can see
This means that the window to increase interest rates and normalize central bank balance sheets is now gone
Money supply will likely continue increasing to absorb sovereign debt issuance, as not doing so will drain liquidity from the financial system and put the fragile economic recovery at risk
This means that cash and government issued bonds are going to be increasingly unattractive as a store of value
Inflationary risks might also be on the rise, making the downside case for cash and bonds even scarier
In light of all of this, it’s prudent to look beyond the financial system for a store of value whose supply can’t be influenced by the authorities
Gold has acted as a store of value and the foundation of a free market economy for centuries, yet it remains completely ignored in most investment portfolios
As you are reading these points, you will notice that there are a lot of similarities between the bull case for gold today, and the one made post the GFC. In fact, we are still in the same thesis. The only difference is that somewhere in the middle, the world was fooled into thinking that we could somehow grow ourselves out of the debt problem, and that this would eventually allow central bankers to normalize interest rates and money supply.
Arriving at a Price Target
This is the hard part, as it’s not an exact science. As I stated at the beginning of this piece, gold is not a productive asset and therefore you cannot apply traditional valuation techniques to arrive at its fair value. However, looking at the value of gold relative to other assets over different cycles historically can give us some clues.
One ratio I find particularly interesting is the ratio of M1 to the value of gold above the ground. M1 is a measure of money supply including physical currency, demand deposits and other ‘near money’ instruments. The thinking behind this ratio is that if central bankers keep increasing M1 through money printing, then gold prices relative to M1 should appreciate as gold will be relatively more attractive to cash as a hedge against monetary debasement.
Paul Tudor Jones published this chart showing that this ratio has reached as high as ~96 during extremes of gold bull markets and ~25 – 37 in other cycles. This would argue for a fair value of gold between $2000 and $6000 / oz based on where M1 is today. But the bull thesis doesn’t stop there, because we all know that M1 is only going one way in the future. This means that there is an opportunity to compound value holding gold for many years to come as central banks flood the economy with money.
The other way to think about the value of gold is through demand. Currently, most Western investors have zero or close to zero exposure to gold. But as banks / sell-side institutions change their tune and start recommending their clients allocate more to the metal, inflows into ETFs like GLD (which are backed by physical gold) will drive gold prices up. The table below quantifies what this demand would look like if institutions decided to hold 5% or even 2% of their AUM in gold:
Finally, we can think about the price of gold relative to financial assets. While I stated earlier that the two are not directly comparable, this ratio represents the relative preference of investors for risky assets vs. safe havens. If investors start doubting the economic recovery, or if geopolitical tensions rise, or if we get hyper inflation or deflation, stocks will not be a very attractive asset class to hold. This would lead to a rotation out of stocks into safer assets; cash, bonds, and (as I believe) increasingly gold.
Gorozen published the following chart in 2018 showing the historical ratio of gold price to the Dow Jones Industrial Average, which reflects relative investor preference between gold and stocks:
During historical gold bull markets, the ratio bottom’ed at somewhere between 1-6x, which would imply a gold price of somewhere between $4500 and $27K / oz.
How to Play This?
There are several avenues to consider depending on risk tolerance. For the highest returns one can consider buying call options on gold futures or on ETFs like GLD. Obviously with options one has to keep timing considerations in mind (especially given how volatile precious metals prices can be) and the fact that leverage cuts both ways.
The next alternative on the risk curve is investing in junior miners (GDXJ) and larger cap miners (GDX). The mining sector remains undervalued relative to it’s free cash flow generation and balance sheet quality at current gold prices. Due to operating leverage, these equities have levered upside to gold prices.
Finally, for the most risk-averse investors just buying and holding bullion exposure through GLD, or in physical form is probably the best way to go.
Gear announced its borrowing base re-determination last week. The credit line is getting cut from $90mm to $60mm. There is an immediate cut to $75mm, with incremental $5mm cuts that will become effective Sept 30 / Dec 31, 2020 and March 31, 2021. So the borrowing base will be $70mm on Sept 30, $65mm by Dec 31 and $60mm by March 31, 2021.
The quantum of the credit line cut is in line with what is being observed for similarly sized oil / gas companies across Canada. The big difference for Gear is that unlike a lot of other small sized producers it had low pre-existing leverage and it will therefore a) be able to manage it’s liquidity effectively even with the production cut and b) will qualify for the government’s BDC borrowing program for small / medium sized energy companies. Gear’s primary lender will apply for the program and in the next few weeks.
The BDC program is designed to help small oil / gas companies that have been impacted by COVID-19 and that were viable businesses prior to the virus impacting the economy. In other words highly leveraged producers will not be bailed out. The size of the program is the sweet spot for a company of Gear’s size. See details below:
The program will be structured as a term loan with a maturity of 4 years, and it will be junior to the company’s existing credit facility in terms of subordination. The max size of $60mm is more than enough for Gear’s needs given management is forecasting $54mm balance drawn on it’s credit facilities even if WTI averages US$35.
For the convertible debenture ($13mm) due in November, the company is likely to negotiate with Burgundy to extend the maturity of the convert. Burgundy has been a long-term supporter of Gear and I’m optimistic that there will be a good outcome there.
Cardinal Energy recently executed a similar exchange for their convertible bond that could be a good template. Interest rate will be higher and conversion price likely lower than the current (current conversion price and interest rate at $0.87 and 4% respectively). However, in the grand scheme of things this is a small price to pay for the massive free cash flow torque to higher oil prices Gear will benefit from in the coming years.
In Cardinal’s case interest rate went up from 5.50% to 8.00% and conversion price was 125% the stock price at the time of the exchange.
Gear also announced recently that it has restarted it’s production program in light of the rebound in oil prices (WTI back to $40). July production is expected to be 5000 boe/d and August will be 6000 boe/d (compared to 1300 boe/d in May and 3700 boe/d for June). For the full year, average production will be 5200 – 5300 boe/d with capital expenditures of $13mm. This should allow Gear to be FCF breakeven while using it’s hedges to reduce it’s debt levels.
Gear has an excellent hedge program which will provide additional liquidity / cash support throughout the year. Based on the price deck I used below, I arrived at a ~$15mm value for the hedges, which is ~35% of the current market cap.
In conclusion, despite the hellish macro environment we are in, there is light at the end of the tunnel for Gear. A combination of govt.’s backstop facilities, hedges, long-term shareholder support and (most importantly) management’s culture of conservativism will help see the company through this crisis. Gear remains the largest investment in my portfolio.